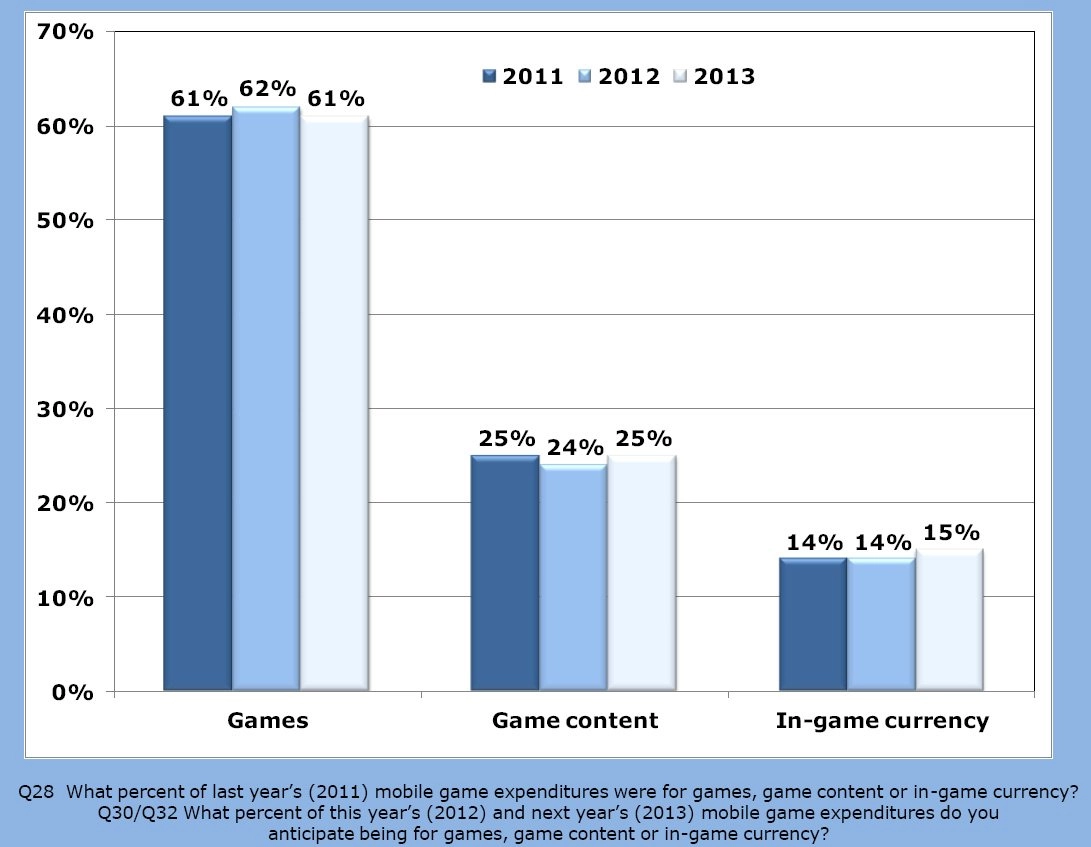
Information Solutions Group recently published some research in conjunction with PopCap about mobile gaming across smartphones and tablets. The survey data was pulled from 1,004 gamers across the UK and U.S., from an initial sample size of 2,301. There were a lot of interesting takeaways, including that 25% had spent cash in 2011 on game content (like extra levels) and 14% on in-game currency. Despite a lot of purists seeing those kinds of microtransactions as the bane of traditional gaming standards, that adoption rate is pretty high. Here are a few other conclusions ISG reached.
- Over the past year the population of mobile gamers in the US and UK who have played a game in the past month increased 29%.
- In the US the number of individuals who have played a mobile game in the past month increased 45% over the past year.
- The average age of a mobile gamer is 39.5 years.
- Those who limit their mobile game play to a tablet are older with an average age of 44.7 years.
- 36% of mobile game players own a tablet.
- One-third use a tablet for at least some of their mobile game play, while two-thirds limit their mobile game play to a phone.
- Tablets are more popular among those new to mobile gaming.
- Mobile game play is shifting away from the phone towards the tablet, with 40% of those playing on both a phone and a tablet, indicating their game play on their phone has declined.
- The number of new mobile gamers (playing for less than one year) has steadily increased since 2009 from 22% to 44%.
- The frequency of mobile game play continues to increase each year, with 96% playing mobile games weekly compared to 84% in 2011.
- The percentage playing daily also increased from 35% in 2011 to 45% over the past year.
- The availability of more free games continues to be the driving force behind increased mobile game play, followed by the acquisition of a phone with better game play capabilities.
- Social game play on a mobile device declined slightly over the past year.
- Half (51%) of mobile gamers have spent real money to purchase a mobile game, game currency and/or game content in the past year, with upgrading from a free game trial or game app to a paid version being the most common purchase.
- More than one-third (37%) will spend more than $10 this year and next, and almost 20% plan to spend more than $50.
While I'm not a huge fan of the whole "premium currency" model that seems to be plastered on just about every game out there, it's hard to argue with if it enables developers to offer their titles for free without severely restricting gameplay. I don't mind not being able to get fancy vanity items or that other players can blast through a game if they're willing to drop a few bucks - so long as it doesn't impact my experience, that's totally fine. It's interesting to see the average age of mobile gamers is so high. Maybe I just make the brash assumption that young punks like me are the only ones playing video games, but devices like the iPhone and iPad have certainly made a wide variety of digital experiences accessible to older generations, including video games.
Do these figures line up with your gaming habits? How much do you spend on average on mobile games in a month?